
Summary
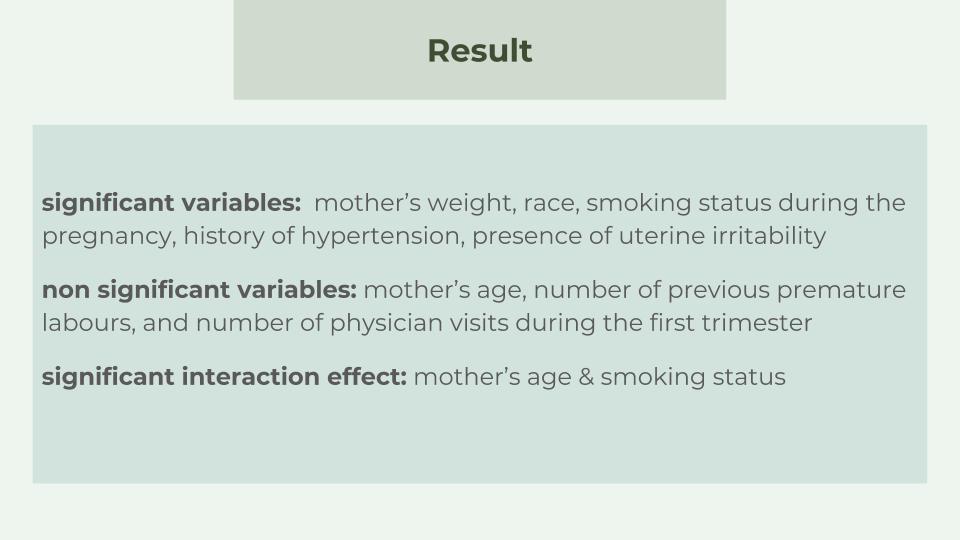
The goal is to study a causal relationship between the birth weights and the risk factors. We have found these statistically significant variables: mother’s weight, race, smoking status during the pregnancy, history of hypertension and presence of uterine irritability. Also, we found that mother’s age and smoking status have significant interaction effects. However, we found mother’s age, number of previous premature labours and number of physician visits during the first trimester has no statistically significant effects on birth weight.
Introduction
The birthweight dataset that we used in this study contains 189 observations that collected at Baystate Medical Center, Springfield, Mass during 1986. It has 9 variables, which are the following:

Age, indicates mother’s age in years.
Weight, abbreviated as lwt, is mother’s weight in pounds at last menstrual period.
Race, a categorical variable, which indicates mother’s race: 1 is White, 2 is black and 3 is other.
Smoke, also a categorical variable: 1 means mother smokes during pregnancy and 0 means mother does not smoke during pregnancy.
Premature labours, which abbreviated as ptl, indicates number of previous premature labours, with a minimum of 0 and maximum of 3.
Hypertension, abbreviated as ht, a binary variable that shows whether the mother has history of hypertension: 1 means yes and 0 means no.
Uterine Irritability, abbreviated as ui, a categorical variables that indicates whether the mother has uterine irritability: 1 means yes and 0 means no.
Physician visists, abbreviated as ftv, indicates number of physician visits during the first trimester, with a min of 0 and max of 6.
Birth weight, abbreviated as bwt, the response variable that we will use in the data analysis, indicates birth weight in grams.
Next, we define birth weight lower than 2500 grams as low and plot a bar plot showing the numbers of low weight and not low weight. The low variable is 31% of the whole data, and nor low variable is 69%. Because we want to see if the following variables influences birth weight, we use the low variable as a reference to help us do the analysis.

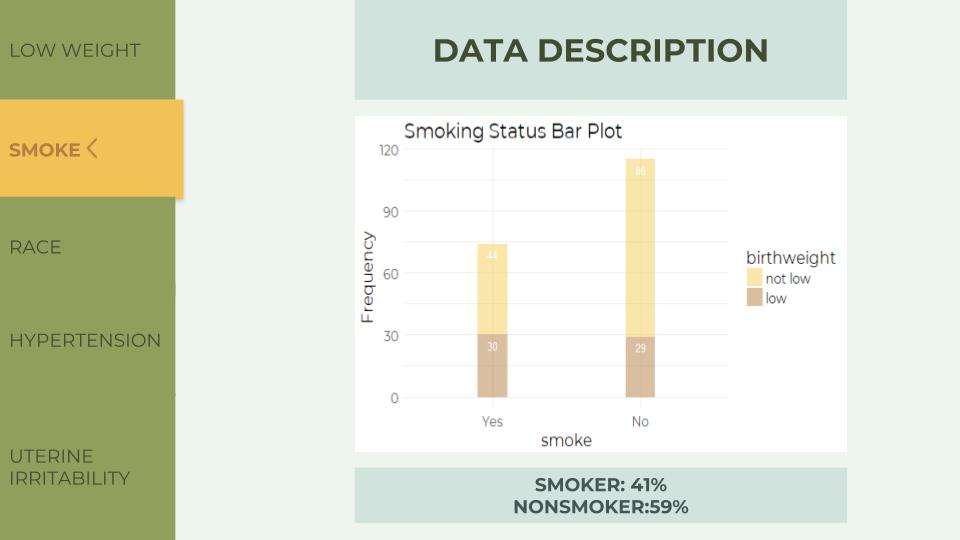
In the Smoking Status Bar Plot, the ratio of low to not low is approximately 1:1 in smokers (point to the left bar), but 1:4 in nonsmokers. Because of the difference in these ratio, we might conclude that smoking status influences birth weight.
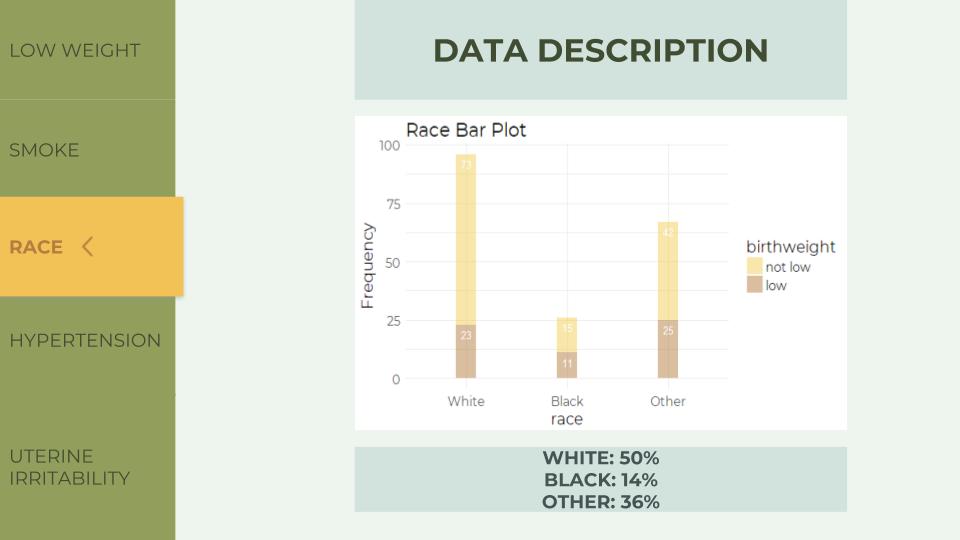
In the Race Bar Plot, the ratio of low to not low is almost 1:3 in white, while almost 1:1 in black and 1:2 in other. Also because of the difference in ratio, the mother’s race might influence birth weight.
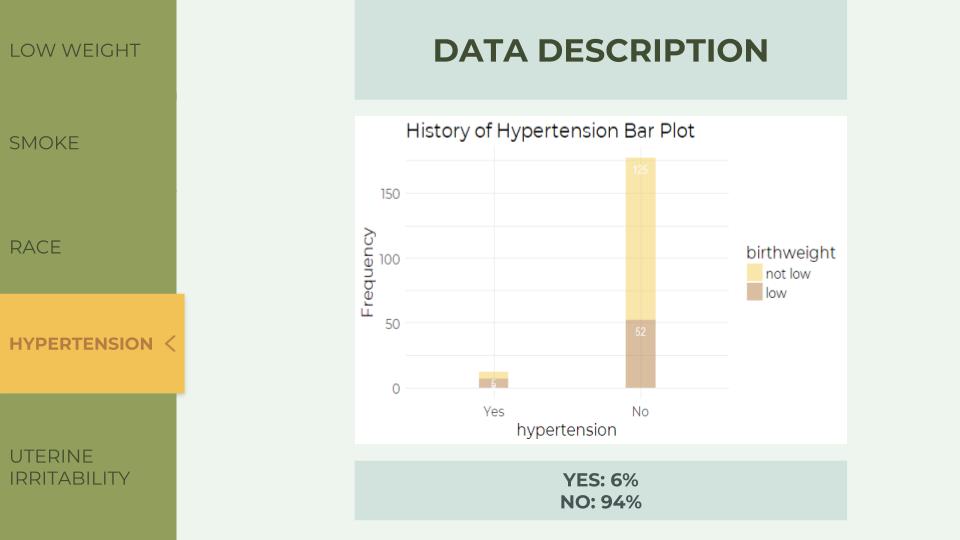
In the Hypertension Bar Plot, the ratio of low to not low is approximately 1:1 on the left and almost 1:5 on the right. History of hypertension also influences birth weight.
In the Uterine Irritability Bar Plot, there is still difference in the ratio. On the left bar, the ratio of low to not low is 1:1, while on the right, the ratio becomes almost 1:3. The presence of uterine irritability also influences birth weight.

Now we have the variables that affect birth weight, we might want to combine the variable that we have not used with the significant variable that we just discovered to see if there is a further relationship.
For example, here is a visualization of the association between mother’s age and birth weight depend on smoking status. In the plot, we can see that the association between age and birth weight is positive for nonsmokers, while being negative for smokers.

Age, indicates mother’s age in years.
Weight, abbreviated as lwt, is mother’s weight in pounds at last menstrual period.
Race, a categorical variable, which indicates mother’s race: 1 is White, 2 is black and 3 is other.
Smoke, also a categorical variable: 1 means mother smokes during pregnancy and 0 means mother does not smoke during pregnancy.
Premature labours, which abbreviated as ptl, indicates number of previous premature labours, with a minimum of 0 and maximum of 3.
Hypertension, abbreviated as ht, a binary variable that shows whether the mother has history of hypertension: 1 means yes and 0 means no.
Uterine Irritability, abbreviated as ui, a categorical variables that indicates whether the mother has uterine irritability: 1 means yes and 0 means no.
Physician visists, abbreviated as ftv, indicates number of physician visits during the first trimester, with a min of 0 and max of 6.
Birth weight, abbreviated as bwt, the response variable that we will use in the data analysis, indicates birth weight in grams.
Next, we define birth weight lower than 2500 grams as low and plot a bar plot showing the numbers of low weight and not low weight. The low variable is 31% of the whole data, and nor low variable is 69%. Because we want to see if the following variables influences birth weight, we use the low variable as a reference to help us do the analysis.
In the Smoking Status Bar Plot, the ratio of low to not low is approximately 1:1 in smokers (point to the left bar), but 1:4 in nonsmokers. Because of the difference in these ratio, we might conclude that smoking status influences birth weight.
In the Race Bar Plot, the ratio of low to not low is almost 1:3 in white, while almost 1:1 in black and 1:2 in other. Also because of the difference in ratio, the mother’s race might influence birth weight.
In the Hypertension Bar Plot, the ratio of low to not low is approximately 1:1 on the left and almost 1:5 on the right. History of hypertension also influences birth weight.
In the Uterine Irritability Bar Plot, there is still difference in the ratio. On the left bar, the ratio of low to not low is 1:1, while on the right, the ratio becomes almost 1:3. The presence of uterine irritability also influences birth weight.
Now we have the variables that affect birth weight, we might want to combine the variable that we have not used with the significant variable that we just discovered to see if there is a further relationship.
For example, here is a visualization of the association between mother’s age and birth weight depend on smoking status. In the plot, we can see that the association between age and birth weight is positive for nonsmokers, while being negative for smokers.
Analysis
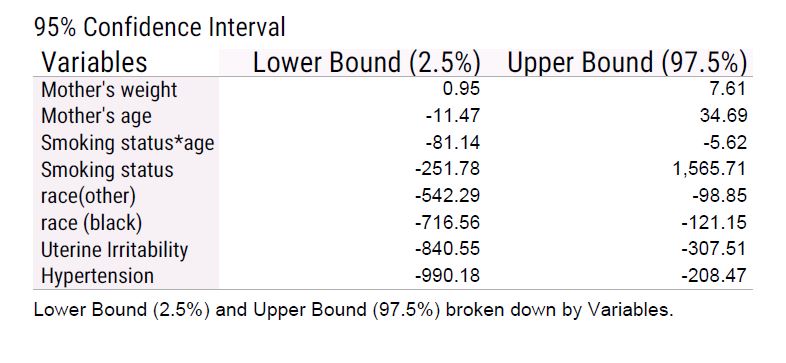
We use linear regression to analyze the dataset, generating a function of birth weight explained by the other 8 variables in our dataset. Based on the analysis, we conclude that at 0.05 significant level, mother’s weight, race, smoking status during pregnancy, history of hypertension, and presence of uterine irritability have significant effects on the birth weight, while mother’s age, number of previous premature labours, and number of physician visits during the first trimester do not have significant effects on the weight of a newborn. Also, the analysis further shows that there is an interaction effect between the mother’s smoking status during the pregnancy and the mother’s age, meaning that the effect of mother’s smoking status on the weight of newborn will change based on the different age of mother. Following are our final model and 95% confidence intervals of coefficients of predictor variables base on our final model.
Final model & 95% confidence intervals
Interpretation of coefficients
Based on our final model, the intercept, which is 2545, does not have a meaningful interpretation since it does not make sense to let mother’s age and weight to be 0.

For the coefficients of predictor variables, we first consider the continuous variables. In our project, mother’s age and weight. Since there is an interaction effect between age and smoking status, we will discuss the coefficient of mother’s age later. The coefficients of mother’s weight is 4, meaning that holding all other variables fixed, increase 1 pound in mother’s weight will increase the birth weight by 4 grams on average. For example, the weight of a baby whose mother’s weight is 121 pounds would be 4 grams on average heavier than the weight of a baby whose mother is 120 pound. Furthermore, according to our 95% confidence interval, we are 95% confident that the increase is a number between 0.947 and 7.61.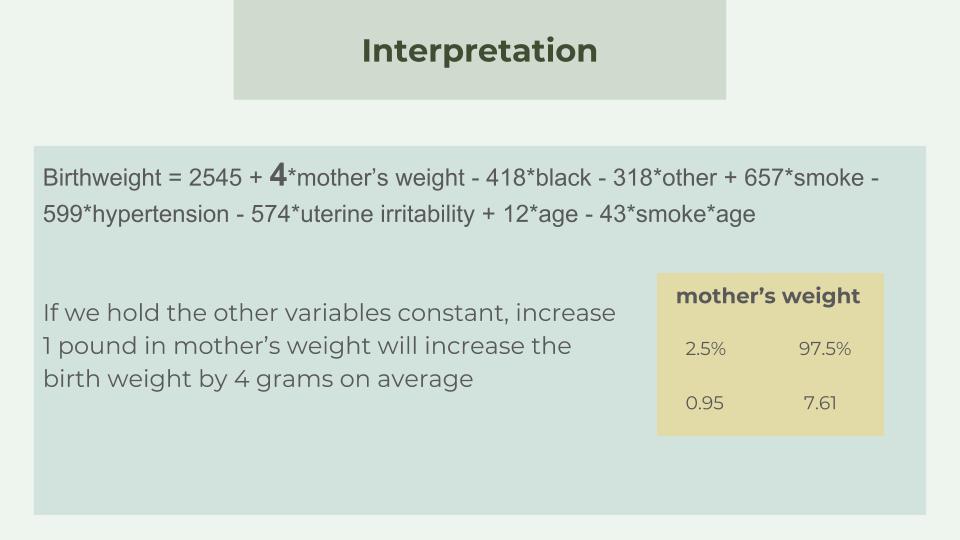
Next, for the coefficients of categorical predictor variables, again we first discuss mother’s race, history of hypertension and uterine irritability since the interpretation of variables without interaction effects is more explicit. The coefficient of black and other (neither white nor black) is -419 and -318, representing that with all other things constant, the weight of a newborn of a black mother will be 419 grams lighter than that of a new born of a mother who is not black, and the weight of a newborn whose mother is neither white nor black will be 318 grams lighter than that of a new born of a black or white mother. Take an account of confidence interval, we are 95% confident that the decrease is a number between 716.56 and 121.15 for a black mother and a number between 542.29 and 98.85.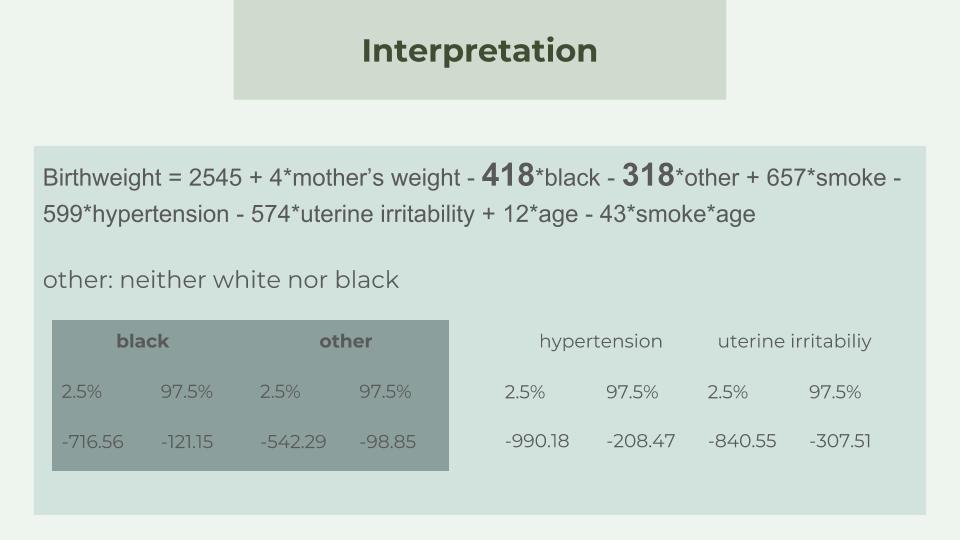
Moreover, the presence of uterine irritability will reduce the birth weight by 574 grams on average and the history of hypertension will decrease the weight of a newborn by 599 grams because the coefficients are -574 and -599, respectively. Again, we are 95% confident that the number is between 840.55 and 307.51 for the presence of uterine irritability and between 990.18 and 208.47 for the history of hypertension.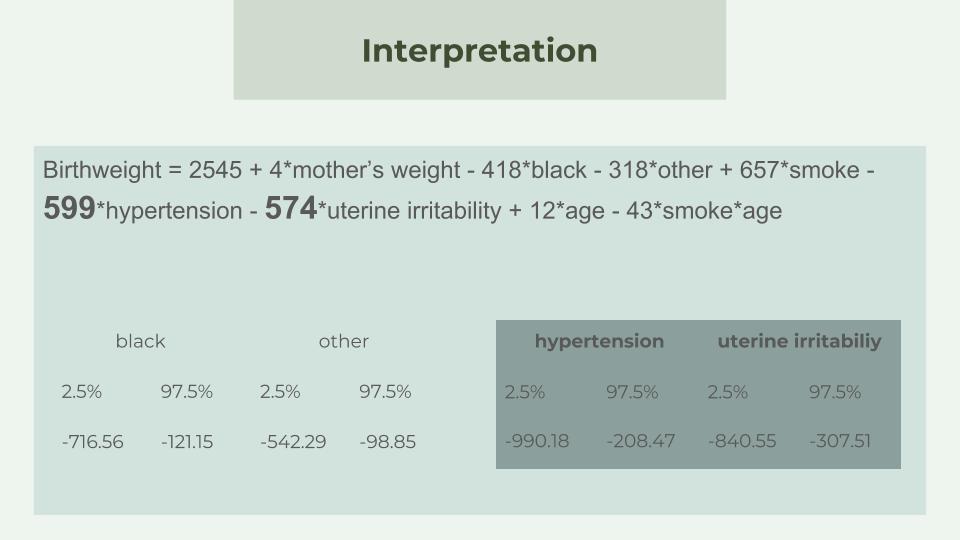
Since there is an interactional effect between the mother’s age and the smoking status, we need to discuss the effects of those two variable more carefully. The model shows that the effect of age is $$12*age - 43*smoke*age$$ For a non smoking mother, the interaction term equals to 0 and hence 1 year increase in mother’s age will increase the weight of a newborn by 12 grams on average. For a mother smoking during the pregnancy, the interaction term becomes -42*1*age and the coefficient of age becomes 12-42 = -30, meaning that each unit increase in mother’s age will decrease the birthweight by 30 grams on average. Together with the confidence intervals, we are 95% confident that the change is a number between -11.47 and 37.69 for a non smoking mother and a number between -92.61 and 32.028 for a smoking mother.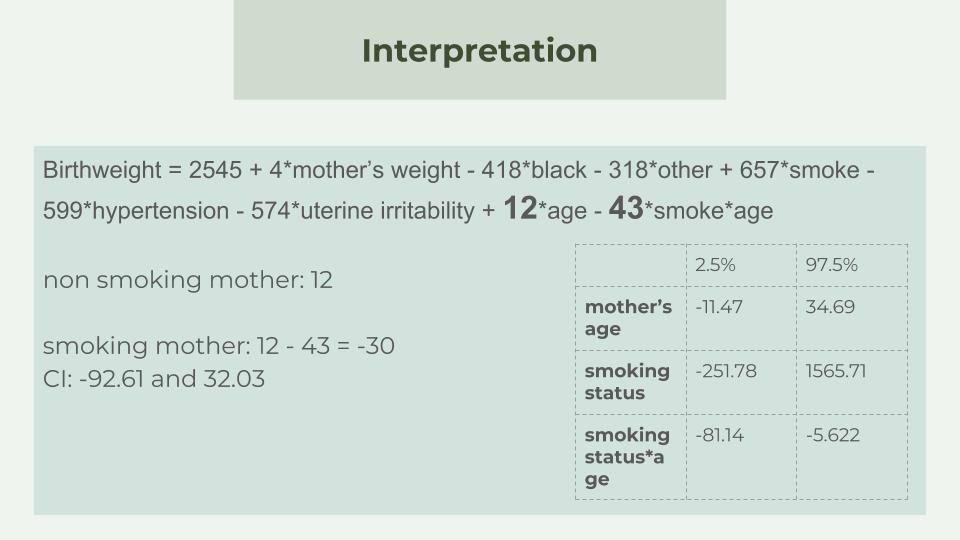
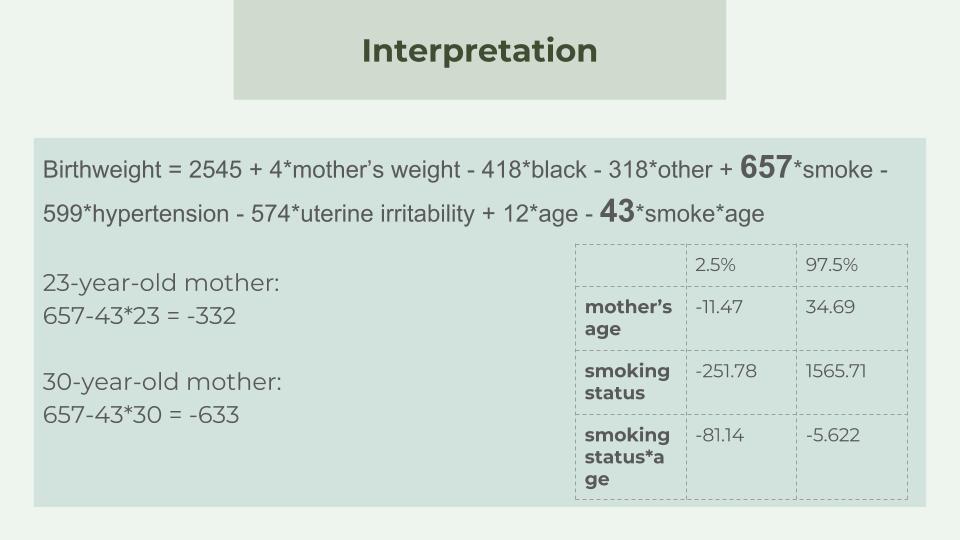
To consider the effect of mothers smoking status, one important thing we should understand is that the effect varies according to different age of mother. For instance, the coefficient of smoking status for a 23-year-old mother is $$657-43*23=-332$$ which is different from the smoking status coefficient for a 30-year-old mother, which is $$657-43*30 = -633$$ This means that on average a 23-year-old mother who smokes during the pregnancy will give birth to a baby whose weight is 332 less than the weight of a newborn of a 23-year-old mother who does not smoke during the pregnancy, while the birth weight of a baby whose mother is 30 years old and smokes during the pregnancy is 633 less that of the baby whose mother is 30 years old and does not smoke during the pregnancy. Similar, the confidence intervals of smoking effect are different for the different mother’s age. However, we do know the confidence intervals of smoking and the coefficient is bounded by -251.78 and 1565.71.
For the coefficients of predictor variables, we first consider the continuous variables. In our project, mother’s age and weight. Since there is an interaction effect between age and smoking status, we will discuss the coefficient of mother’s age later. The coefficients of mother’s weight is 4, meaning that holding all other variables fixed, increase 1 pound in mother’s weight will increase the birth weight by 4 grams on average. For example, the weight of a baby whose mother’s weight is 121 pounds would be 4 grams on average heavier than the weight of a baby whose mother is 120 pound. Furthermore, according to our 95% confidence interval, we are 95% confident that the increase is a number between 0.947 and 7.61.
Next, for the coefficients of categorical predictor variables, again we first discuss mother’s race, history of hypertension and uterine irritability since the interpretation of variables without interaction effects is more explicit. The coefficient of black and other (neither white nor black) is -419 and -318, representing that with all other things constant, the weight of a newborn of a black mother will be 419 grams lighter than that of a new born of a mother who is not black, and the weight of a newborn whose mother is neither white nor black will be 318 grams lighter than that of a new born of a black or white mother. Take an account of confidence interval, we are 95% confident that the decrease is a number between 716.56 and 121.15 for a black mother and a number between 542.29 and 98.85.
Moreover, the presence of uterine irritability will reduce the birth weight by 574 grams on average and the history of hypertension will decrease the weight of a newborn by 599 grams because the coefficients are -574 and -599, respectively. Again, we are 95% confident that the number is between 840.55 and 307.51 for the presence of uterine irritability and between 990.18 and 208.47 for the history of hypertension.
Since there is an interactional effect between the mother’s age and the smoking status, we need to discuss the effects of those two variable more carefully. The model shows that the effect of age is $$12*age - 43*smoke*age$$ For a non smoking mother, the interaction term equals to 0 and hence 1 year increase in mother’s age will increase the weight of a newborn by 12 grams on average. For a mother smoking during the pregnancy, the interaction term becomes -42*1*age and the coefficient of age becomes 12-42 = -30, meaning that each unit increase in mother’s age will decrease the birthweight by 30 grams on average. Together with the confidence intervals, we are 95% confident that the change is a number between -11.47 and 37.69 for a non smoking mother and a number between -92.61 and 32.028 for a smoking mother.
To consider the effect of mothers smoking status, one important thing we should understand is that the effect varies according to different age of mother. For instance, the coefficient of smoking status for a 23-year-old mother is $$657-43*23=-332$$ which is different from the smoking status coefficient for a 30-year-old mother, which is $$657-43*30 = -633$$ This means that on average a 23-year-old mother who smokes during the pregnancy will give birth to a baby whose weight is 332 less than the weight of a newborn of a 23-year-old mother who does not smoke during the pregnancy, while the birth weight of a baby whose mother is 30 years old and smokes during the pregnancy is 633 less that of the baby whose mother is 30 years old and does not smoke during the pregnancy. Similar, the confidence intervals of smoking effect are different for the different mother’s age. However, we do know the confidence intervals of smoking and the coefficient is bounded by -251.78 and 1565.71.
Conclusion
Birth weight is one of the biggest concerns to physicians for years even in developed country. This is due to the fact that infant mortality rates and birth defect rates are very high for low birth weight babies. Low birth weight has been defined by the World Health Organization (WHO) as weight at birth of less than 2,500 grams (5.5 pounds).
A woman's behaviour during pregnancy can greatly alter the chances of carrying the baby to term and, consequently, of delivering a baby of normal birth weight. So this is the motivation of our study.
The goal of this study was to identify risk factors strongly correlated with birth weight.
Our Data set contains 189 women on 9 variables, which was collected at Baystate Medical Center in Springfield during 1986. It was a routine data set, which means there was not any specific setting.
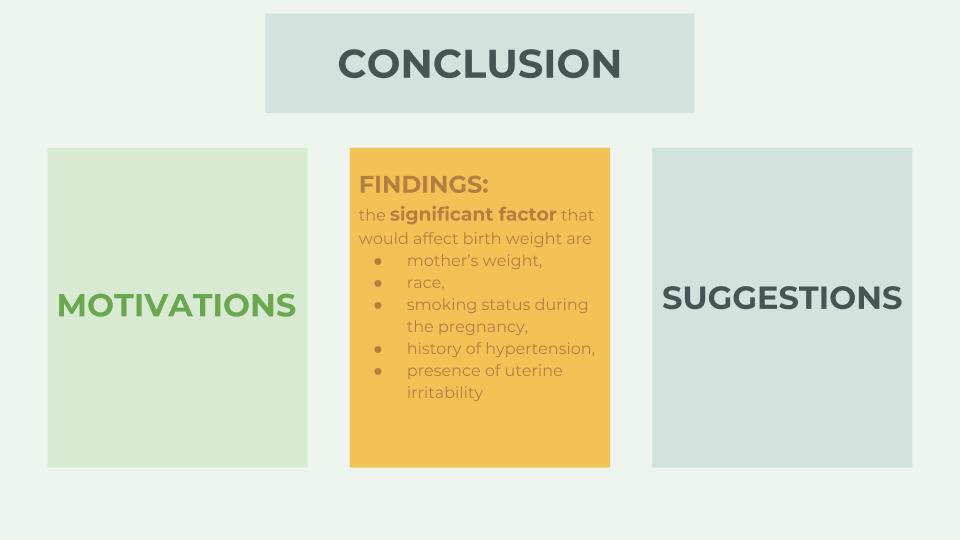
We used two ways to do data analysis. One is using bar graph to show data in terms of different variables. The other is using statistical model( linear regression model) to analyze data. The result we derived from both methods have the same conclusion. They reveal that the significant factors that would affect birth weight are mother’s weight, race, smoking status during the pregnancy, history of hypertension, presence of uterine irritability. The rest variables, such as age are not key factors. In terms of 2 variables interaction, mother’s age and smoking status have significant impact as well.
A woman's behaviour during pregnancy can greatly alter the chances of carrying the baby to term and, consequently, of delivering a baby of normal birth weight. So this is the motivation of our study.
The goal of this study was to identify risk factors strongly correlated with birth weight.
Our Data set contains 189 women on 9 variables, which was collected at Baystate Medical Center in Springfield during 1986. It was a routine data set, which means there was not any specific setting.
We used two ways to do data analysis. One is using bar graph to show data in terms of different variables. The other is using statistical model( linear regression model) to analyze data. The result we derived from both methods have the same conclusion. They reveal that the significant factors that would affect birth weight are mother’s weight, race, smoking status during the pregnancy, history of hypertension, presence of uterine irritability. The rest variables, such as age are not key factors. In terms of 2 variables interaction, mother’s age and smoking status have significant impact as well.
Suggestion
All of these key factors are more of less related to Women’s lifestyle and health. Women’s lifestyle and health status play important role in their babies’ birth weight. Health education should be a big part of low birth weight prevention. Maintaining and expanding women’s health education is our suggestion. It should be provided in a variety of settings, particularly in family planning clinics and schools. More importantly, we also need to focus on the role of men in choices about reproduction.
Credits
Rui Hu contributes to the Introduction. Yang Cai is in charge of Data Description and exploratory data analysis. Yushu Wu contributes to analysis part. Shuo Du contributes to Conclusion and Suggestion.